A Shot Count and a Shot Map Support Different Claims
A raw shot count and a shot map from the same match support different claims. Here is what each can honestly carry, and the presentation traps to avoid.
A raw shot count and a shot map from the same match support different claims. Here is what each can honestly carry, and the presentation traps to avoid.
The cutoff and relay throw that beats a runner at the plate is usually decided before the outfielder ever touches the ball. Here is the four-role sequence.
Athlete owned media replaced the press conference for some of the biggest names in sport. What changed in access, control, and accountability.
Five substitutes changed how the last ten minutes of a match play out: windows, concussion swaps, time-wasting, and what officials add back.
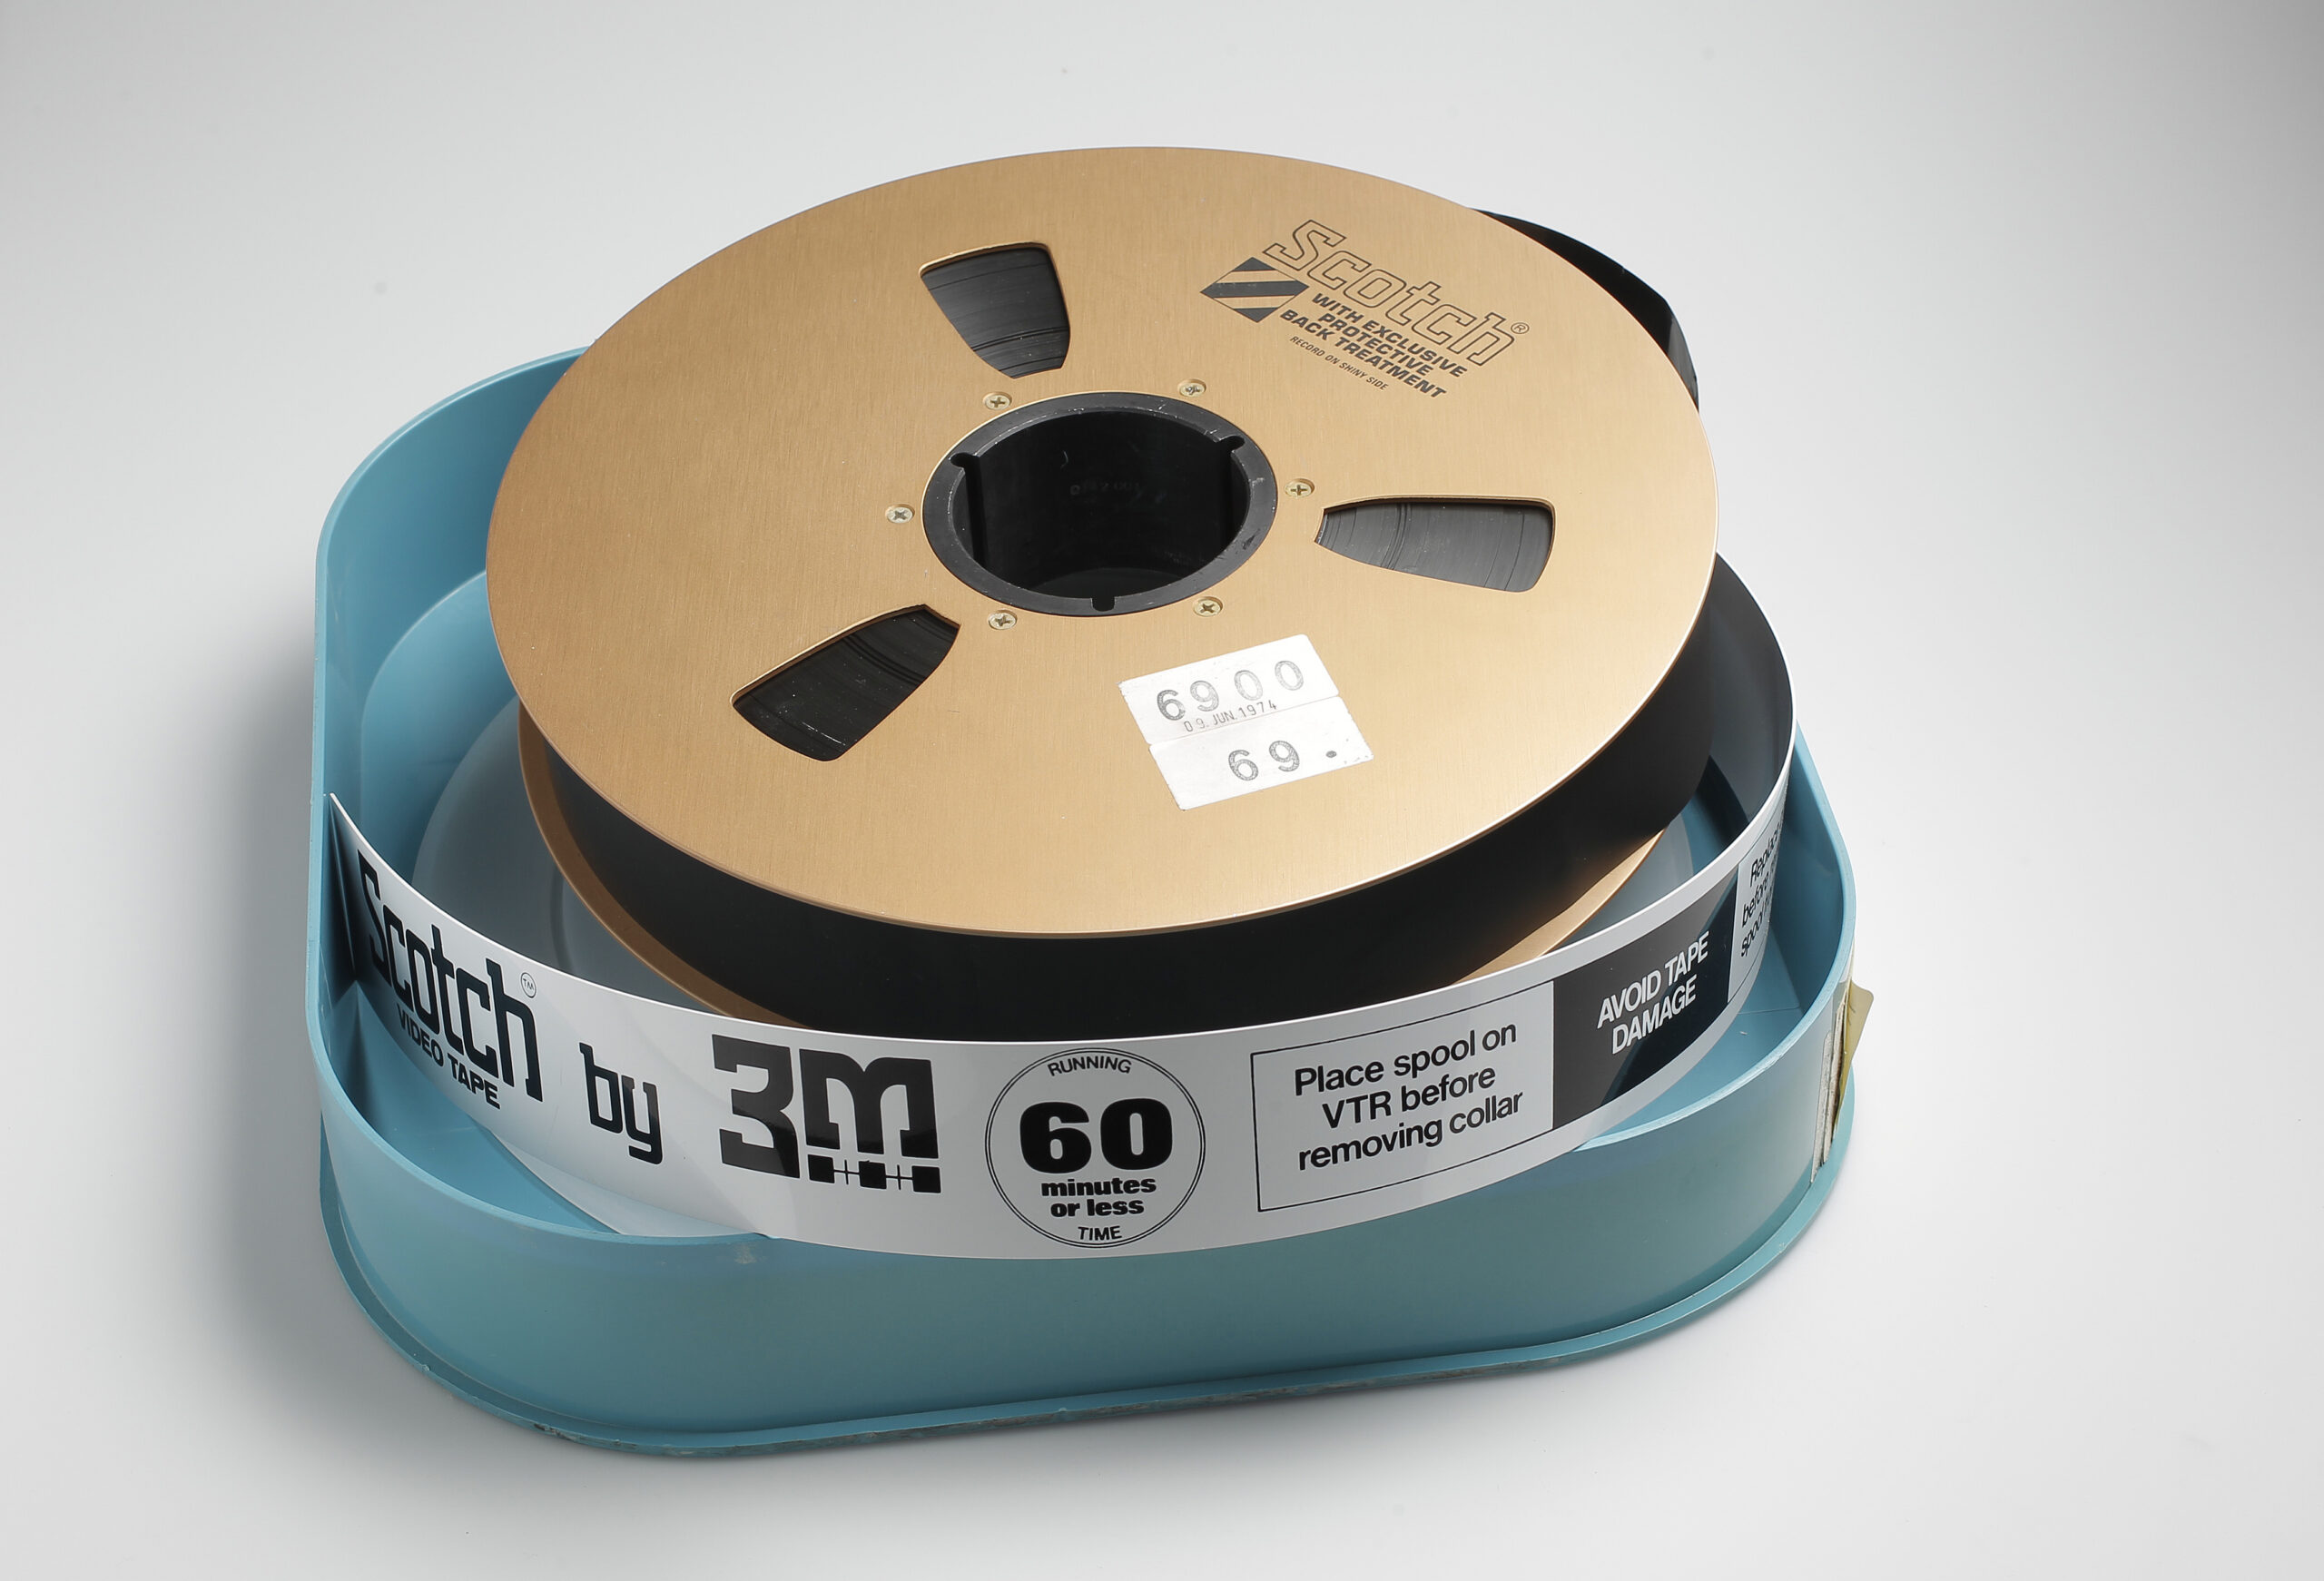
Lost sports footage is rarely negligence: tape reuse, obsolete formats and split rights explain why famous matches survive only as short highlights.
Four angles that hold up when you report a one-sided game, the two that always read as padding, and which match numbers stop meaning anything.
What a rondo drill is meant to train, the four setup mistakes that turn it into a passing circle, and the constraints that put the pressure back in.
What interpretation removes from translated athlete interviews, and five rules for quoting a player who spoke to the room through an interpreter.
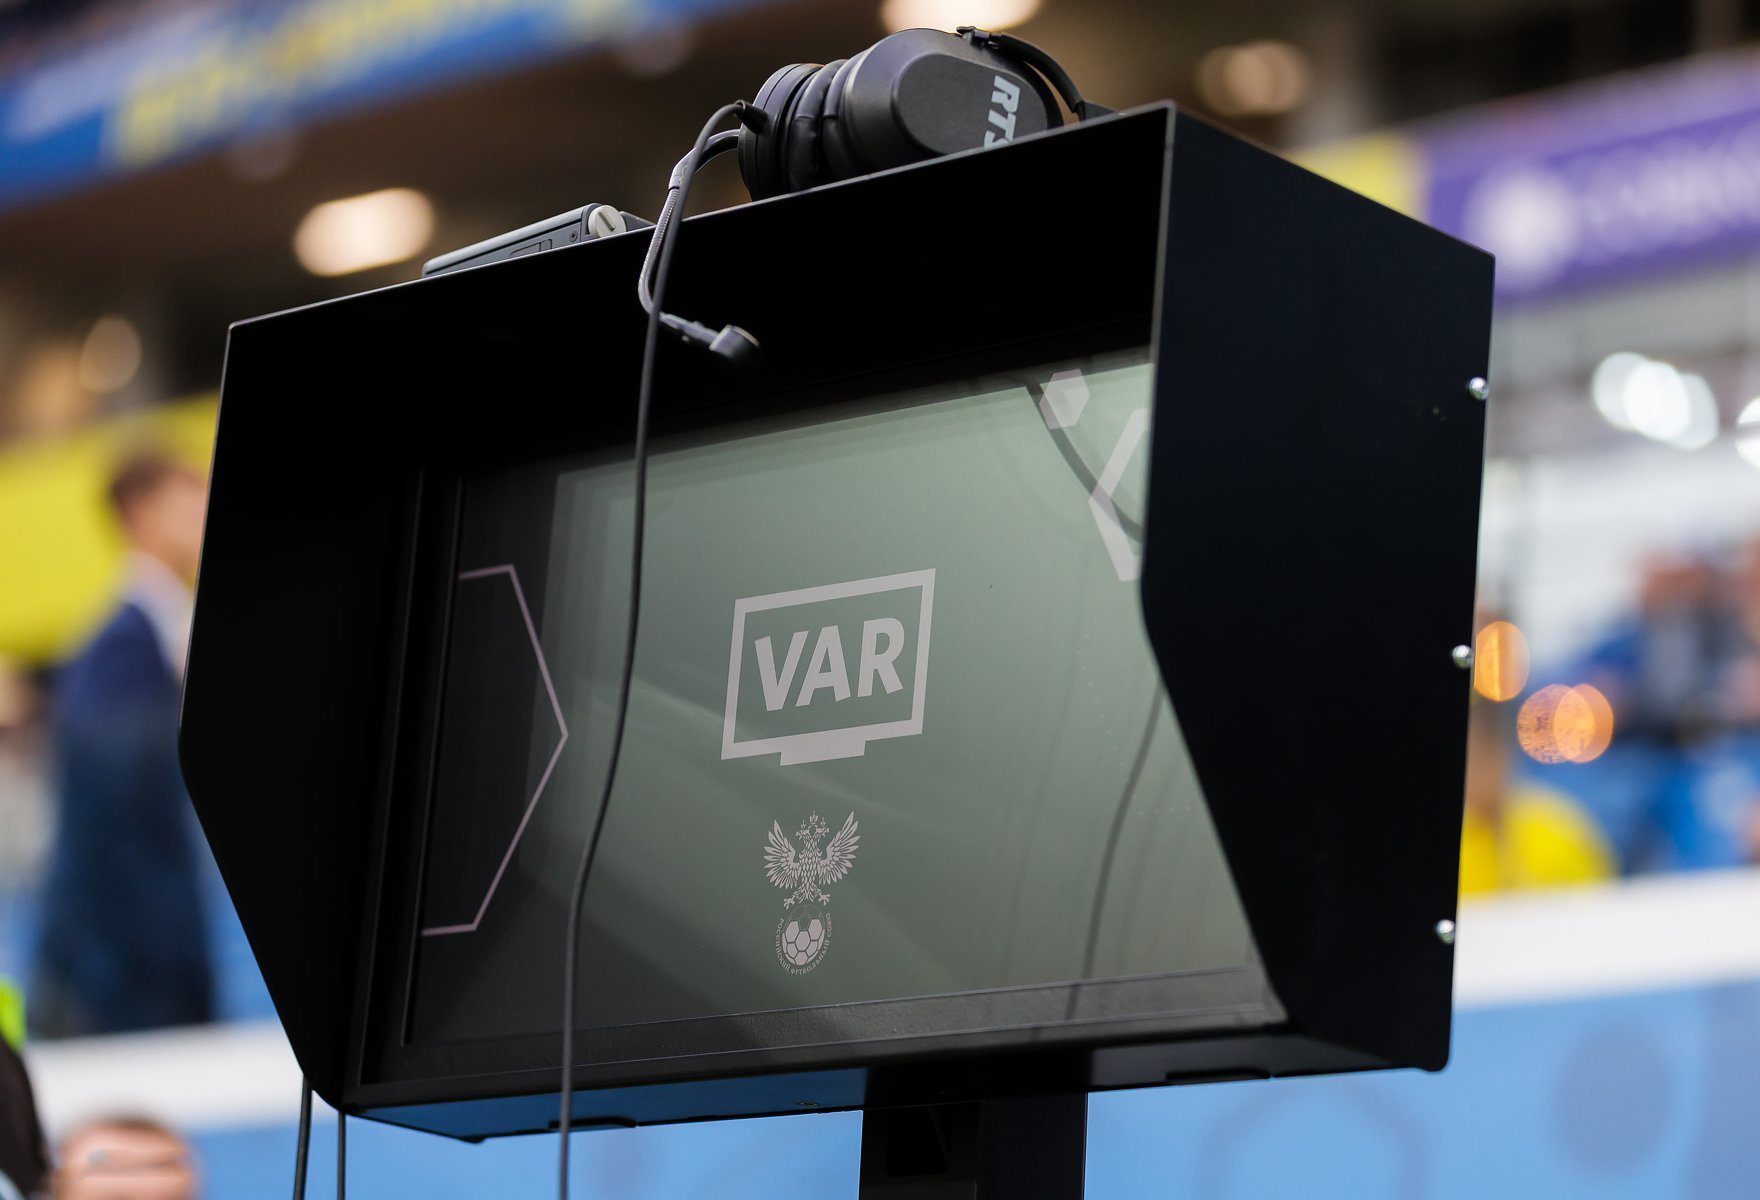
The video review threshold compared across football, American football, hockey and cricket: what triggers a check, what overturns a call and who decides.
How scouts watch film: scanning, body orientation, recovery lines and reaction to a turnover, and why a highlight reel removes all four of them.